
MetricsSummaryDisplay#
- class skore.MetricsSummaryDisplay(summary, report_type, errors)[source]#
Summarize evaluation metrics in a table.
- Parameters:
- summarypandas.DataFrame
Long-format dataframe storing one row per metric observation, with the metric scores and their metadata (e.g.
name,verbose_name,estimator,data_source,label,output,average,split,score).- report_type{“estimator”, “comparison-estimator”, “cross-validation”, “comparison-cross-validation”}
The type of report.
- errorslist of tuple of (Metric, Exception)
Metric failures encountered while building the summary.
- Attributes:
- summarypandas.DataFrame
The long-format dataframe storing the metric scores and metadata.
- report_typeReportType
The type of report.
See also
EstimatorReport.metrics.summarizeCreate this display from a report.
RocCurveDisplayPlot ROC curves.
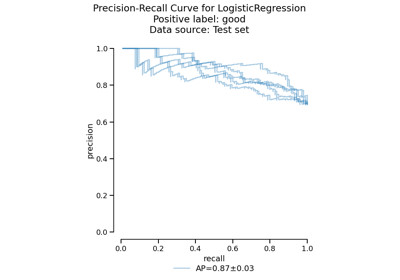
PrecisionRecallCurveDisplayPlot precision-recall curves.
ConfusionMatrixDisplayDisplay the confusion matrix.
PredictionErrorDisplayPlot regression prediction error.
- frame(*, favorability=False, verbose_name=False, flat_index=True, aggregate=('mean', 'std'))[source]#
Return the metrics summary as a table.
- Parameters:
- favorabilitybool, default=False
Whether to add a column indicating whether higher
(↗︎)or lower(↘︎)values are better for each metric.- verbose_namebool, default=False
Whether to use the human-readable metric names instead of the technical names (e.g.
"Accuracy"instead of"accuracy"). Incompatible withflat_index=True.- flat_indexbool, default=True
Whether to flatten MultiIndex row/column labels. Incompatible with
verbose_name=True.- aggregate{“mean”, “std”}, list of such str or None, default=(“mean”, “std”)
Only used for cross-validation reports. Functions to aggregate the scores across the cross-validation splits.
Nonereturns the scores for each split.
- Returns:
- pandas.DataFrame or pandas.Series
The metrics summary pivoted into a table. For layouts with a single value column, a
pandas.Seriesis returned.
Examples
>>> from sklearn.datasets import load_breast_cancer
>>> from sklearn.linear_model import LogisticRegression
>>> from skore import evaluate
>>> X, y = load_breast_cancer(return_X_y=True)
>>> estimator = LogisticRegression(max_iter=10_000)
>>> report = evaluate(estimator, X, y)
>>> metrics = report.metrics.summarize().frame()
>>> metrics.loc["accuracy"]  # Series for single-estimator layout
- set_style(*, policy='update', **kwargs)[source]#
Set the style parameters for the display.
- Parameters:
- policyLiteral[“override”, “update”], default=”update”
Policy to use when setting the style parameters. If “override”, existing settings are set to the provided values. If “update”, existing settings are not changed; only settings that were previously unset are changed.
- **kwargsdict
Style parameters to set. Each parameter name should correspond to a a style attribute passed to the plot method of the display.
- Returns:
- None
- Raises:
- ValueError
If a style parameter is unknown.
- static style_plot(plot_func)[source]#
Apply consistent style to skore displays.
This decorator: 1. Applies default style settings 2. Runs
plot_funcunderplt.ioff()so figures are not shown until returned 3. CallsFigure.tight_layout()on the returned figure when applicable 4. Restores the original style settings- Parameters:
- plot_funccallable
The plot function to be decorated.
- Returns:
- callable
The decorated plot function.