

Note
Go to the end to download the full example code.
SKD007 - MDI feature importance is biased for high-cardinality features#
This example demonstrates the limitations that SKD007 warns against on tree models. Mean decrease in impurity (MDI) tends to rank high-cardinality categorical or continuous columns as more important than features with as much signal but lower cardinality. This is due to the tree building process picking high cardinality features more often as they offer more split points to choose from.
Mitigations from the Automated checks user guide:
use permutation importance instead of MDI,
cross-check MDI with permutation importance or drop-column importance.
We will compare MDI to permutation importance to show that it gives a more reliable estimate of feature importance. The same contrast is illustrated in scikit-learn’s Permutation Importance vs Random Forest Feature Importance (MDI) example.
We fit a RandomForestRegressor on a 1,500-row
subsample of California housing. The goal is to show the limitations of
impurity based importance and show they do not affect permutation importance
on a test set.
Load the California housing dataset#
Continuous columns such as AveRooms and AveOccup take many distinct
values: above the 50 % of samples threshold SKD007 uses for high-cardinality
features.
import numpy as np
from sklearn.model_selection import train_test_split
from skrub.datasets import fetch_california_housing

housing = fetch_california_housing()
X_full, y_full = housing.X, housing.y

X, _, y, _ = train_test_split(
    X_full,
    y_full,
    train_size=1_500,
    random_state=42,
)
Let us add two random features that carry no signal about the target: a continuous draw from a normal distribution, and a categorical feature with 20 levels sampled uniformly (stored as integer codes so the forest can split on them directly). High-cardinality noise can still receive non-zero MDI, and often more MDI than low-cardinality noise, while permutation importance on the test set should stay near zero for both.
rng = np.random.default_rng(42)
X["noise_cont"] = rng.normal(size=len(X))
X["noise_cat"] = rng.integers(0, 20, size=len(X))
Let us inspect the feature matrix with TableReport.
from skrub import TableReport

TableReport(X)
| MedInc | HouseAge | AveRooms | AveBedrms | Population | AveOccup | Latitude | Longitude | noise_cont | noise_cat | |
|---|---|---|---|---|---|---|---|---|---|---|
| 1,763 | 3.67 | 45.0 | 4.18 | 0.889 | 702. | 2.60 | 38.0 | -122. | 0.305 | 8 |
| 18,259 | 5.08 | 36.0 | 6.03 | 0.995 | 485. | 2.44 | 37.4 | -122. | -1.04 | 16 |
| 13,547 | 1.17 | 37.0 | 4.02 | 0.977 | 1.13e+03 | 3.21 | 34.1 | -117. | 0.750 | 5 |
| 11,536 | 1.72 | 27.0 | 3.67 | 1.02 | 847. | 1.35 | 33.8 | -118. | 0.941 | 4 |
| 15,069 | 2.98 | 35.0 | 4.52 | 0.959 | 681. | 2.77 | 32.8 | -117. | -1.95 | 6 |
| 11,284 | 6.37 | 35.0 | 6.13 | 0.926 | 658. | 3.03 | 33.8 | -118. | -1.10 | 15 |
| 11,964 | 3.05 | 33.0 | 6.87 | 1.27 | 1.75e+03 | 3.90 | 34.0 | -117. | 0.323 | 1 |
| 5,390 | 2.93 | 36.0 | 3.99 | 1.08 | 1.76e+03 | 3.33 | 34.0 | -118. | -1.15 | 3 |
| 860 | 5.72 | 15.0 | 6.40 | 1.07 | 1.78e+03 | 3.18 | 37.6 | -122. | 0.712 | 5 |
| 15,795 | 2.58 | 52.0 | 3.40 | 1.06 | 2.62e+03 | 2.11 | 37.8 | -122. | -1.18 | 5 |
MedInc
Float64DType- Null values
- 0 (0.0%)
- Unique values
-
1,380 (92.0%)
This column has a high cardinality (> 40).
- Mean ± Std
- 3.86 ± 1.89
- Median ± IQR
- 3.51 ± 2.19
- Min | Max
- 0.536 | 15.0
HouseAge
Float64DType- Null values
- 0 (0.0%)
- Unique values
-
51 (3.4%)
This column has a high cardinality (> 40).
- Mean ± Std
- 28.3 ± 12.5
- Median ± IQR
- 28.0 ± 19.0
- Min | Max
- 2.00 | 52.0
AveRooms
Float64DType- Null values
- 0 (0.0%)
- Unique values
-
1,491 (99.4%)
This column has a high cardinality (> 40).
- Mean ± Std
- 5.43 ± 2.17
- Median ± IQR
- 5.26 ± 1.59
- Min | Max
- 1.63 | 47.5
AveBedrms
Float64DType- Null values
- 0 (0.0%)
- Unique values
-
1,408 (93.9%)
This column has a high cardinality (> 40).
- Mean ± Std
- 1.10 ± 0.421
- Median ± IQR
- 1.05 ± 0.0934
- Min | Max
- 0.810 | 11.2
Population
Float64DType- Null values
- 0 (0.0%)
- Unique values
-
1,128 (75.2%)
This column has a high cardinality (> 40).
- Mean ± Std
- 1.43e+03 ± 1.07e+03
- Median ± IQR
- 1.17e+03 ± 970.
- Min | Max
- 3.00 | 1.22e+04
AveOccup
Float64DType- Null values
- 0 (0.0%)
- Unique values
-
1,478 (98.5%)
This column has a high cardinality (> 40).
- Mean ± Std
- 2.94 ± 0.921
- Median ± IQR
- 2.83 ± 0.868
- Min | Max
- 0.750 | 21.3
Latitude
Float64DType- Null values
- 0 (0.0%)
- Unique values
-
458 (30.5%)
This column has a high cardinality (> 40).
- Mean ± Std
- 35.5 ± 2.09
- Median ± IQR
- 34.2 ± 3.72
- Min | Max
- 32.6 | 41.8
Longitude
Float64DType- Null values
- 0 (0.0%)
- Unique values
-
483 (32.2%)
This column has a high cardinality (> 40).
- Mean ± Std
- -119. ± 1.97
- Median ± IQR
- -118. ± 3.57
- Min | Max
- -124. | -114.
noise_cont
Float64DType- Null values
- 0 (0.0%)
- Unique values
-
1,500 (100.0%)
This column has a high cardinality (> 40).
- Mean ± Std
- -0.0206 ± 1.00
- Median ± IQR
- 0.00380 ± 1.30
- Min | Max
- -3.65 | 3.18
noise_cat
Int64DType- Null values
- 0 (0.0%)
- Unique values
- 20 (1.3%)
- Mean ± Std
- 9.39 ± 5.76
- Median ± IQR
- 9 ± 10
- Min | Max
- 0 | 19
No columns match the selected filter: . You can change the column filter in the dropdown menu above.
| Column | Column name | dtype | Is sorted | Null values | Unique values | Mean | Std | Min | Median | Max |
|---|---|---|---|---|---|---|---|---|---|---|
| 0 | MedInc | Float64DType | False | 0 (0.0%) | 1380 (92.0%) | 3.86 | 1.89 | 0.536 | 3.51 | 15.0 |
| 1 | HouseAge | Float64DType | False | 0 (0.0%) | 51 (3.4%) | 28.3 | 12.5 | 2.00 | 28.0 | 52.0 |
| 2 | AveRooms | Float64DType | False | 0 (0.0%) | 1491 (99.4%) | 5.43 | 2.17 | 1.63 | 5.26 | 47.5 |
| 3 | AveBedrms | Float64DType | False | 0 (0.0%) | 1408 (93.9%) | 1.10 | 0.421 | 0.810 | 1.05 | 11.2 |
| 4 | Population | Float64DType | False | 0 (0.0%) | 1128 (75.2%) | 1.43e+03 | 1.07e+03 | 3.00 | 1.17e+03 | 1.22e+04 |
| 5 | AveOccup | Float64DType | False | 0 (0.0%) | 1478 (98.5%) | 2.94 | 0.921 | 0.750 | 2.83 | 21.3 |
| 6 | Latitude | Float64DType | False | 0 (0.0%) | 458 (30.5%) | 35.5 | 2.09 | 32.6 | 34.2 | 41.8 |
| 7 | Longitude | Float64DType | False | 0 (0.0%) | 483 (32.2%) | -119. | 1.97 | -124. | -118. | -114. |
| 8 | noise_cont | Float64DType | False | 0 (0.0%) | 1500 (100.0%) | -0.0206 | 1.00 | -3.65 | 0.00380 | 3.18 |
| 9 | noise_cat | Int64DType | False | 0 (0.0%) | 20 (1.3%) | 9.39 | 5.76 | 0 | 9 | 19 |
No columns match the selected filter: . You can change the column filter in the dropdown menu above.
MedInc
Float64DType- Null values
- 0 (0.0%)
- Unique values
-
1,380 (92.0%)
This column has a high cardinality (> 40).
- Mean ± Std
- 3.86 ± 1.89
- Median ± IQR
- 3.51 ± 2.19
- Min | Max
- 0.536 | 15.0
HouseAge
Float64DType- Null values
- 0 (0.0%)
- Unique values
-
51 (3.4%)
This column has a high cardinality (> 40).
- Mean ± Std
- 28.3 ± 12.5
- Median ± IQR
- 28.0 ± 19.0
- Min | Max
- 2.00 | 52.0
AveRooms
Float64DType- Null values
- 0 (0.0%)
- Unique values
-
1,491 (99.4%)
This column has a high cardinality (> 40).
- Mean ± Std
- 5.43 ± 2.17
- Median ± IQR
- 5.26 ± 1.59
- Min | Max
- 1.63 | 47.5
AveBedrms
Float64DType- Null values
- 0 (0.0%)
- Unique values
-
1,408 (93.9%)
This column has a high cardinality (> 40).
- Mean ± Std
- 1.10 ± 0.421
- Median ± IQR
- 1.05 ± 0.0934
- Min | Max
- 0.810 | 11.2
Population
Float64DType- Null values
- 0 (0.0%)
- Unique values
-
1,128 (75.2%)
This column has a high cardinality (> 40).
- Mean ± Std
- 1.43e+03 ± 1.07e+03
- Median ± IQR
- 1.17e+03 ± 970.
- Min | Max
- 3.00 | 1.22e+04
AveOccup
Float64DType- Null values
- 0 (0.0%)
- Unique values
-
1,478 (98.5%)
This column has a high cardinality (> 40).
- Mean ± Std
- 2.94 ± 0.921
- Median ± IQR
- 2.83 ± 0.868
- Min | Max
- 0.750 | 21.3
Latitude
Float64DType- Null values
- 0 (0.0%)
- Unique values
-
458 (30.5%)
This column has a high cardinality (> 40).
- Mean ± Std
- 35.5 ± 2.09
- Median ± IQR
- 34.2 ± 3.72
- Min | Max
- 32.6 | 41.8
Longitude
Float64DType- Null values
- 0 (0.0%)
- Unique values
-
483 (32.2%)
This column has a high cardinality (> 40).
- Mean ± Std
- -119. ± 1.97
- Median ± IQR
- -118. ± 3.57
- Min | Max
- -124. | -114.
noise_cont
Float64DType- Null values
- 0 (0.0%)
- Unique values
-
1,500 (100.0%)
This column has a high cardinality (> 40).
- Mean ± Std
- -0.0206 ± 1.00
- Median ± IQR
- 0.00380 ± 1.30
- Min | Max
- -3.65 | 3.18
noise_cat
Int64DType- Null values
- 0 (0.0%)
- Unique values
- 20 (1.3%)
- Mean ± Std
- 9.39 ± 5.76
- Median ± IQR
- 9 ± 10
- Min | Max
- 0 | 19
No columns match the selected filter: . You can change the column filter in the dropdown menu above.
| Column 1 | Column 2 | Cramér's V | Pearson's Correlation |
|---|---|---|---|
| AveRooms | AveBedrms | 0.720 | 0.809 |
| Latitude | Longitude | 0.535 | -0.924 |
| MedInc | AveRooms | 0.253 | 0.395 |
| HouseAge | Longitude | 0.176 | -0.0476 |
| AveRooms | Longitude | 0.160 | -0.0384 |
| AveOccup | noise_cont | 0.145 | 0.0581 |
| HouseAge | Latitude | 0.136 | -0.0398 |
| HouseAge | Population | 0.135 | -0.292 |
| AveBedrms | Longitude | 0.131 | 0.0324 |
| AveOccup | Longitude | 0.121 | 0.157 |
| Population | AveOccup | 0.121 | 0.176 |
| AveOccup | Latitude | 0.116 | -0.147 |
| HouseAge | AveRooms | 0.106 | -0.187 |
| MedInc | HouseAge | 0.102 | -0.147 |
| AveRooms | Latitude | 0.101 | 0.124 |
| AveOccup | noise_cat | 0.0977 | -0.0309 |
| MedInc | Latitude | 0.0967 | -0.0541 |
| AveBedrms | Latitude | 0.0954 | 0.0609 |
| HouseAge | AveOccup | 0.0922 | 0.0372 |
| AveBedrms | noise_cat | 0.0889 | -0.0226 |
| Longitude | noise_cat | 0.0868 | 0.0206 |
| Latitude | noise_cat | 0.0864 | -0.0164 |
| AveRooms | noise_cat | 0.0862 | -0.00400 |
| noise_cont | noise_cat | 0.0859 | 0.00858 |
| Population | Latitude | 0.0847 | -0.0627 |
| Population | Longitude | 0.0835 | 0.0591 |
| HouseAge | noise_cat | 0.0820 | 0.00306 |
| Population | noise_cat | 0.0808 | -0.0349 |
| Longitude | noise_cont | 0.0805 | -0.0212 |
| AveBedrms | noise_cont | 0.0795 | 0.0398 |
| MedInc | Longitude | 0.0794 | -0.0368 |
| HouseAge | AveBedrms | 0.0754 | -0.0916 |
| MedInc | noise_cat | 0.0741 | 0.0127 |
| MedInc | Population | 0.0712 | -0.0118 |
| MedInc | AveOccup | 0.0711 | -0.0681 |
| AveRooms | noise_cont | 0.0708 | 0.0495 |
| Latitude | noise_cont | 0.0677 | 0.0270 |
| Population | noise_cont | 0.0676 | -0.00111 |
| HouseAge | noise_cont | 0.0669 | 0.0305 |
| MedInc | noise_cont | 0.0669 | 0.00776 |
| MedInc | AveBedrms | 0.0512 | -0.0627 |
| AveRooms | Population | 0.0420 | -0.104 |
| AveRooms | AveOccup | 0.0324 | -0.0654 |
| AveBedrms | AveOccup | 0.0284 | -0.0771 |
| AveBedrms | Population | 0.0272 | -0.0773 |
Please enable javascript
The skrub table reports need javascript to display correctly. If you are displaying a report in a Jupyter notebook and you see this message, you may need to re-execute the cell or to trust the notebook (button on the top right or "File > Trust notebook").
| MedHouseVal | |
|---|---|
| 1,763 | 1.34 |
| 18,259 | 3.73 |
| 13,547 | 0.709 |
| 11,536 | 0.675 |
| 15,069 | 1.36 |
| 11,284 | 2.29 |
| 11,964 | 0.978 |
| 5,390 | 2.22 |
| 860 | 2.83 |
| 15,795 | 3.25 |
MedHouseVal
Float64DType- Null values
- 0 (0.0%)
- Unique values
-
1,072 (71.5%)
This column has a high cardinality (> 40).
- Mean ± Std
- 2.07 ± 1.16
- Median ± IQR
- 1.79 ± 1.43
- Min | Max
- 0.250 | 5.00
No columns match the selected filter: . You can change the column filter in the dropdown menu above.
| Column | Column name | dtype | Is sorted | Null values | Unique values | Mean | Std | Min | Median | Max |
|---|---|---|---|---|---|---|---|---|---|---|
| 0 | MedHouseVal | Float64DType | False | 0 (0.0%) | 1072 (71.5%) | 2.07 | 1.16 | 0.250 | 1.79 | 5.00 |
No columns match the selected filter: . You can change the column filter in the dropdown menu above.
MedHouseVal
Float64DType- Null values
- 0 (0.0%)
- Unique values
-
1,072 (71.5%)
This column has a high cardinality (> 40).
- Mean ± Std
- 2.07 ± 1.16
- Median ± IQR
- 1.79 ± 1.43
- Min | Max
- 0.250 | 5.00
No columns match the selected filter: . You can change the column filter in the dropdown menu above.
Please enable javascript
The skrub table reports need javascript to display correctly. If you are displaying a report in a Jupyter notebook and you see this message, you may need to re-execute the cell or to trust the notebook (button on the top right or "File > Trust notebook").
Counting unique values per column previews which features SKD007 will flag.
X.nunique().sort_values(ascending=False)
noise_cont    1500
AveRooms      1491
AveOccup      1478
AveBedrms     1408
MedInc        1380
Population    1128
Longitude      483
Latitude       458
HouseAge        51
noise_cat       20
dtype: int64
Trigger SKD007 with a random forest on continuous features#
A random forest exposes feature_importances_ based on MDI. After fitting,
let us inspect impurity decrease with skore.
from sklearn.ensemble import RandomForestRegressor
from skore import TrainTestSplit, evaluate

splitter = TrainTestSplit(random_state=42)

report = evaluate(
    RandomForestRegressor(random_state=42),
    X=X,
    y=y,
    splitter=splitter,
)
report
| Metric | RandomForestRegressor |
|---|---|
| R² | 0.737305 |
| RMSE | 0.610720 |
| MAE | 0.413099 |
| MAPE | 0.242566 |
| Fit time (s) | 0.723016 |
| Predict time (s) | 0.016945 |
- [SKD001] Potential overfitting. Significant train/test gaps were found for 4/4 default predictive metrics.
- [SKD007] MDI biased for high-cardinality features. High-cardinality features detected: MedInc, AveRooms, AveBedrms (and 3 more). Mean Decrease in Impurity (MDI) importance is biased toward such features. Consider using permutation importance for a more robust alternative.
- [SKD016] Estimator not tuned. Estimator(s) left at default settings; consider tuning: ['max_features', 'min_samples_leaf'] for RandomForestRegressor.
- [SKD003] Inconsistent performance across splits. Not applicable to estimator reports.
- [SKD004] High class imbalance. ML task is not binary classification. Got regression.
- [SKD005] Underrepresented classes. ML task is not multiclass classification. Got regression.
- [SKD006] Coefficient interpretation. Estimator is not a linear model: it does not have a `coef_` attribute.
- [SKD013] Train-test overlap in time series. No datetime column found.
- [SKD014] Hyperparameters at search edge. Estimator is not a BaseSearchCV instance. Got RandomForestRegressor.
- [SKD015] Hyperparameters worth tuning. Estimator is not a BaseSearchCV instance. Got RandomForestRegressor.
No checks were muted.
Fast mode is on: expensive checks are skipped unless already cached.
Mute a check by passing its code to ignore, e.g. .checks.summarize(ignore=['SKD001']).
RandomForestRegressor(random_state=42)In a Jupyter environment, please rerun this cell to show the HTML representation or trust the notebook.
On GitHub, the HTML representation is unable to render, please try loading this page with nbviewer.org.
Parameters
Fitted attributes
| MedInc | HouseAge | AveRooms | AveBedrms | Population | AveOccup | Latitude | Longitude | noise_cont | noise_cat | MedHouseVal | |
|---|---|---|---|---|---|---|---|---|---|---|---|
| 0 | 3.69 | 33.0 | 6.56 | 1.23 | 652. | 2.85 | 38.6 | -121. | -1.60 | 17 | 0.993 |
| 1 | 3.44 | 22.0 | 5.79 | 1.02 | 1.20e+03 | 3.24 | 39.1 | -122. | -2.39 | 8 | 1.02 |
| 2 | 4.46 | 40.0 | 5.48 | 0.936 | 756. | 2.68 | 37.6 | -122. | -1.07 | 17 | 3.08 |
| 3 | 1.55 | 52.0 | 5.02 | 1.00 | 311. | 3.11 | 39.7 | -122. | -1.15 | 14 | 2.00 |
| 4 | 4.41 | 23.0 | 5.67 | 0.989 | 1.58e+03 | 2.96 | 34.0 | -117. | 1.82 | 7 | 1.30 |
| 1,495 | 2.31 | 52.0 | 2.70 | 1.09 | 679. | 1.48 | 34.0 | -119. | 0.736 | 10 | 5.00 |
| 1,496 | 2.91 | 27.0 | 3.80 | 1.12 | 2.01e+03 | 3.67 | 33.9 | -118. | 0.0389 | 0 | 1.84 |
| 1,497 | 2.52 | 28.0 | 3.79 | 1.07 | 1.36e+03 | 4.76 | 34.0 | -118. | -0.115 | 10 | 1.32 |
| 1,498 | 4.68 | 16.0 | 5.35 | 1.09 | 2.53e+03 | 3.10 | 37.6 | -122. | 0.184 | 1 | 2.56 |
| 1,499 | 2.30 | 17.0 | 4.93 | 1.13 | 2.02e+03 | 3.00 | 33.8 | -117. | -1.86 | 17 | 0.893 |
MedInc
Float64DType- Null values
- 0 (0.0%)
- Unique values
-
1,380 (92.0%)
This column has a high cardinality (> 40).
- Mean ± Std
- 3.86 ± 1.89
- Median ± IQR
- 3.51 ± 2.19
- Min | Max
- 0.536 | 15.0
HouseAge
Float64DType- Null values
- 0 (0.0%)
- Unique values
-
51 (3.4%)
This column has a high cardinality (> 40).
- Mean ± Std
- 28.3 ± 12.5
- Median ± IQR
- 28.0 ± 19.0
- Min | Max
- 2.00 | 52.0
AveRooms
Float64DType- Null values
- 0 (0.0%)
- Unique values
-
1,491 (99.4%)
This column has a high cardinality (> 40).
- Mean ± Std
- 5.43 ± 2.17
- Median ± IQR
- 5.26 ± 1.59
- Min | Max
- 1.63 | 47.5
AveBedrms
Float64DType- Null values
- 0 (0.0%)
- Unique values
-
1,408 (93.9%)
This column has a high cardinality (> 40).
- Mean ± Std
- 1.10 ± 0.421
- Median ± IQR
- 1.05 ± 0.0934
- Min | Max
- 0.810 | 11.2
Population
Float64DType- Null values
- 0 (0.0%)
- Unique values
-
1,128 (75.2%)
This column has a high cardinality (> 40).
- Mean ± Std
- 1.43e+03 ± 1.07e+03
- Median ± IQR
- 1.17e+03 ± 970.
- Min | Max
- 3.00 | 1.22e+04
AveOccup
Float64DType- Null values
- 0 (0.0%)
- Unique values
-
1,478 (98.5%)
This column has a high cardinality (> 40).
- Mean ± Std
- 2.94 ± 0.921
- Median ± IQR
- 2.83 ± 0.868
- Min | Max
- 0.750 | 21.3
Latitude
Float64DType- Null values
- 0 (0.0%)
- Unique values
-
458 (30.5%)
This column has a high cardinality (> 40).
- Mean ± Std
- 35.5 ± 2.09
- Median ± IQR
- 34.2 ± 3.72
- Min | Max
- 32.6 | 41.8
Longitude
Float64DType- Null values
- 0 (0.0%)
- Unique values
-
483 (32.2%)
This column has a high cardinality (> 40).
- Mean ± Std
- -119. ± 1.97
- Median ± IQR
- -118. ± 3.57
- Min | Max
- -124. | -114.
noise_cont
Float64DType- Null values
- 0 (0.0%)
- Unique values
-
1,500 (100.0%)
This column has a high cardinality (> 40).
- Mean ± Std
- -0.0206 ± 1.00
- Median ± IQR
- 0.00380 ± 1.30
- Min | Max
- -3.65 | 3.18
noise_cat
Int64DType- Null values
- 0 (0.0%)
- Unique values
- 20 (1.3%)
- Mean ± Std
- 9.39 ± 5.76
- Median ± IQR
- 9 ± 10
- Min | Max
- 0 | 19
MedHouseVal
Float64DType- Null values
- 0 (0.0%)
- Unique values
-
1,072 (71.5%)
This column has a high cardinality (> 40).
- Mean ± Std
- 2.07 ± 1.16
- Median ± IQR
- 1.79 ± 1.43
- Min | Max
- 0.250 | 5.00
No columns match the selected filter: . You can change the column filter in the dropdown menu above.
| Column | Column name | dtype | Is sorted | Null values | Unique values | Mean | Std | Min | Median | Max |
|---|---|---|---|---|---|---|---|---|---|---|
| 0 | MedInc | Float64DType | False | 0 (0.0%) | 1380 (92.0%) | 3.86 | 1.89 | 0.536 | 3.51 | 15.0 |
| 1 | HouseAge | Float64DType | False | 0 (0.0%) | 51 (3.4%) | 28.3 | 12.5 | 2.00 | 28.0 | 52.0 |
| 2 | AveRooms | Float64DType | False | 0 (0.0%) | 1491 (99.4%) | 5.43 | 2.17 | 1.63 | 5.26 | 47.5 |
| 3 | AveBedrms | Float64DType | False | 0 (0.0%) | 1408 (93.9%) | 1.10 | 0.421 | 0.810 | 1.05 | 11.2 |
| 4 | Population | Float64DType | False | 0 (0.0%) | 1128 (75.2%) | 1.43e+03 | 1.07e+03 | 3.00 | 1.17e+03 | 1.22e+04 |
| 5 | AveOccup | Float64DType | False | 0 (0.0%) | 1478 (98.5%) | 2.94 | 0.921 | 0.750 | 2.83 | 21.3 |
| 6 | Latitude | Float64DType | False | 0 (0.0%) | 458 (30.5%) | 35.5 | 2.09 | 32.6 | 34.2 | 41.8 |
| 7 | Longitude | Float64DType | False | 0 (0.0%) | 483 (32.2%) | -119. | 1.97 | -124. | -118. | -114. |
| 8 | noise_cont | Float64DType | False | 0 (0.0%) | 1500 (100.0%) | -0.0206 | 1.00 | -3.65 | 0.00380 | 3.18 |
| 9 | noise_cat | Int64DType | False | 0 (0.0%) | 20 (1.3%) | 9.39 | 5.76 | 0 | 9 | 19 |
| 10 | MedHouseVal | Float64DType | False | 0 (0.0%) | 1072 (71.5%) | 2.07 | 1.16 | 0.250 | 1.79 | 5.00 |
No columns match the selected filter: . You can change the column filter in the dropdown menu above.
Please enable javascript
The skrub table reports need javascript to display correctly. If you are displaying a report in a Jupyter notebook and you see this message, you may need to re-execute the cell or to trust the notebook (button on the top right or "File > Trust notebook").
SKD007 warns about high-cardinality columns such as MedInc and
AveOccup. The synthetic continuous noise column is high-cardinality as
well, so it belongs in the same tip.
report.checks.summarize(fast_mode=True)
Let us plot MDI with features sorted by importance.
import matplotlib.pyplot as plt

mdi_display = report.inspection.impurity_decrease()
_ = mdi_display.plot(sorting_order="descending")
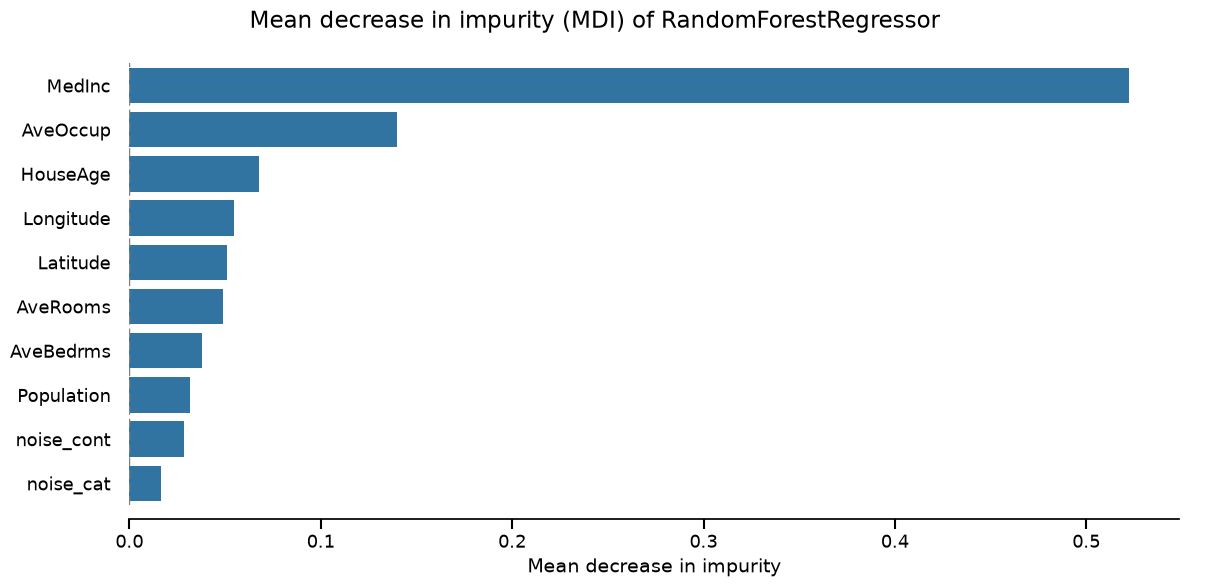
The two synthetic noise columns are not near zero under MDI: impurity still
assigns them mass. noise_cont in particular is high-cardinality, so the
forest can keep finding splits on it even though it carries no target signal.
Use permutation importance instead of MDI#
permutation_importance() shuffles each
column on the test set and measures the score drop. The result is not biased
toward high-cardinality split points the way MDI is.
perm_display = report.inspection.permutation_importance(
    seed=42,
    n_repeats=5,
)
_ = perm_display.plot(sorting_order="descending")
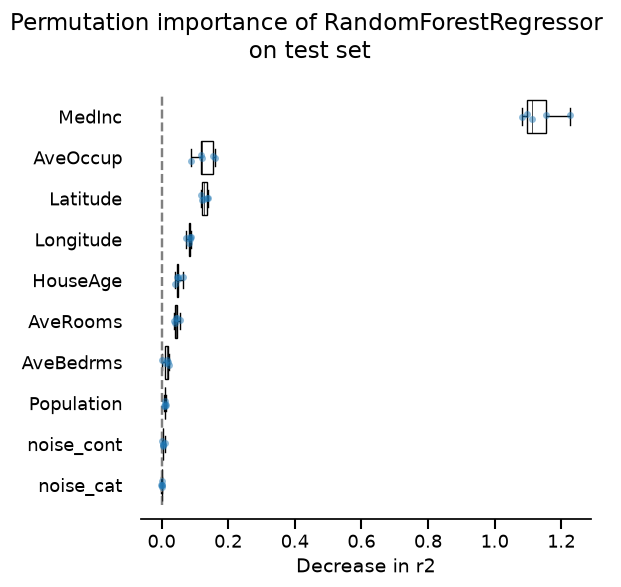
Under permutation importance the noisy features sit at (or very near) zero: shuffling them does not change the test score, so they are not contributing to predicting the target.
Cross-check MDI with permutation importance#
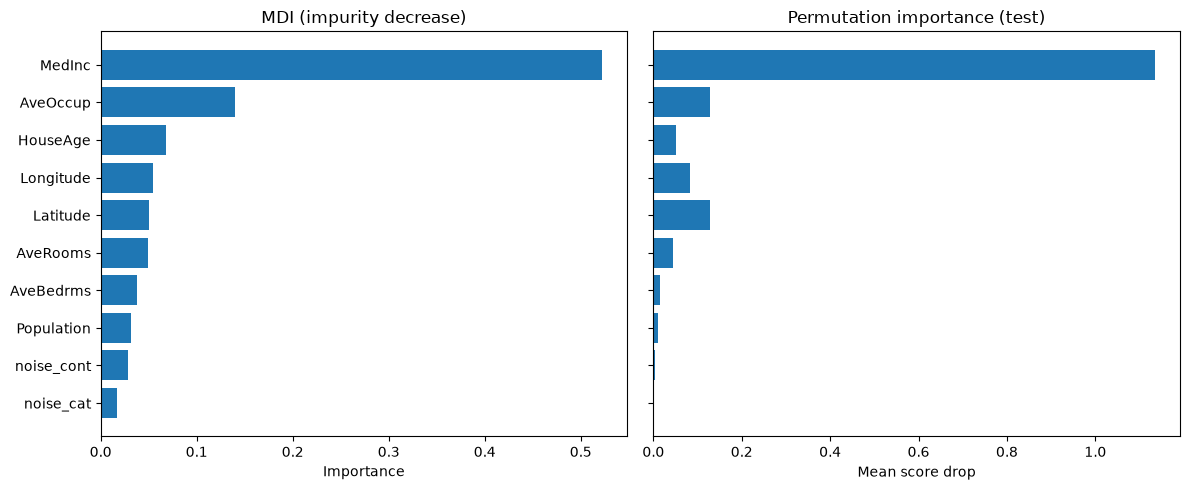
Let us put the two rankings side by side. Sorting by MDI tends to push
high-cardinality columns (including noise_cont) upward; permutation
importance on the test set should keep both synthetic features near the
bottom even when MDI does not.
mdi = (
    mdi_display.frame(sorting_order="descending")
    .set_index("feature")
    .rename(columns={"importance": "mdi"})
)
perm = (
    perm_display.frame(sorting_order="descending")
    .set_index("feature")[["value_mean"]]
    .rename(columns={"value_mean": "permutation"})
)
nunique = X.nunique().rename("nunique")

comparison = (
    mdi.join(perm)
    .join(nunique)
    .assign(
        mdi_rank=lambda df: df["mdi"].rank(ascending=False).astype(int),
        perm_rank=lambda df: df["permutation"].rank(ascending=False).astype(int),
    )
    .sort_values("mdi", ascending=False)
)
comparison
The side-by-side bars make the disagreement easier to read: impurity can
assign mass to noise_cont (and sometimes more than to noise_cat),
while permutation importance stays close to zero for both.
fig, axes = plt.subplots(1, 2, figsize=(12, 5), sharey=True)
order = comparison.sort_values("mdi", ascending=True).index

axes[0].barh(order, comparison.loc[order, "mdi"])
axes[0].set_title("MDI (impurity decrease)")
axes[0].set_xlabel("Importance")

axes[1].barh(order, comparison.loc[order, "permutation"])
axes[1].set_title("Permutation importance (test)")
axes[1].set_xlabel("Mean score drop")

fig.tight_layout()
_ = fig
Conclusion#
SKD007 warns that MDI feature importance favors high-cardinality inputs such
as AveOccup and can inflate the role of irrelevant high-cardinality noise.
In this walkthrough, permutation importance gave a more reliable picture of
which features actually move test scores. When importance is a decision
factor, we prefer permutation (or drop-column tests) over impurity alone.
Total running time of the script: (0 minutes 4.161 seconds)