TableReportDisplay#
- class skore.TableReportDisplay(summary)[source]#
Display reporting information about a given dataset.
This display summarizes the dataset and provides a way to visualize the distribution of its columns.
- Parameters:
- summarydict
The summary of the dataset, as returned by
summarize_dataframe.
- Attributes:
- ax_matplotlib axes
The axes of the figure.
- figure_matplotlib figure.
The figure of the plot.
Examples
>>> from sklearn.datasets import load_breast_cancer
>>> from sklearn.linear_model import LogisticRegression
>>> from skore import train_test_split
>>> from skore import EstimatorReport
>>> X, y = load_breast_cancer(return_X_y=True)
>>> split_data = train_test_split(X=X, y=y, random_state=0, as_dict=True)
>>> classifier = LogisticRegression(max_iter=10_000)
>>> report = EstimatorReport(classifier, **split_data)
>>> display = report.data.analyze()
>>> display.plot(kind="corr")
- frame(*, kind='dataset')[source]#
Get the data related to the table report.
- Parameters:
- kind{‘dataset’, ‘top-associations’}
The kind of data to return.
- Returns:
- DataFrame
The dataset used to create the table report.
- plot(*, x=None, y=None, hue=None, kind='dist', top_k_categories=20, scatterplot_kwargs=None, stripplot_kwargs=None, boxplot_kwargs=None, heatmap_kwargs=None, histplot_kwargs=None)[source]#
Plot distribution or correlation of the columns from the dataset.
- Parameters:
- xstr, default=None
The name of the column to use for the x-axis of the plot. Mandatory when
kind='dist'.- ystr, default=None
The name of the column to use for the y-axis of the plot. Only used when
kind='dist'.- huestr, default=None
The name of the column to use for the color or hue axis of the plot. Only used when
kind='dist'.- kind{‘dist’, ‘corr’}, default=’dist’
The kind of plot drawn.
If
'dist', plot a distribution parametrized byx,yandhue. When onlyxis defined, the distribution is 1d. Whenyis also defined, the plot is the 2d. Finally, when the color is set usinghue, the distribution is 2d, with a color per data-point based onhue. This mode handle both numeric and categorical columns.If
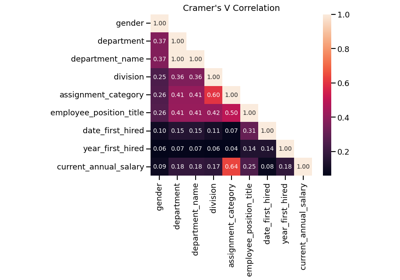
'corr', plot Cramer’s V correlation among all columns. This option doesn’t take anyx,yorhueargument.
- top_k_categoriesint, default=20
For categorical columns, the number of most frequent elements to display. Only used when
kind='dist'.- scatterplot_kwargs: dict, default=None
Keyword arguments to be passed to seaborn’s
seaborn.scatterplot()for rendering the distribution 2D plot, when bothxandyare numeric.- stripplot_kwargs: dict, default=None
Keyword arguments to be passed to seaborn’s
searborn.stripplot()for rendering the distribution 2D plot, when eitherxoryis numeric, and the other is categorical. This plot is drawn on top of the boxplot.- boxplot_kwargs: dict, default=None
Keyword arguments to be passed to seaborn’s
seaborn.boxplot()for rendering the distribution 2D plot, when eitherxoryis numeric, and the other is categorical. This plot is drawn below the stripplot.- heatmap_kwargs: dict, default=None
Keyword arguments to be passed to seaborn’s
seaborn.heatmap()for rendering Cramer’s V correlation matrix, whenkind='corr'or whenkind='dist'and bothxandyare categorical.- histplot_kwargs: dict, default=None
Keyword arguments to be passed to seaborn’s
seaborn.histplot()for rendering the distribution 1D plot, when onlyxis provided.
Examples
>>> from sklearn.datasets import load_breast_cancer
>>> from sklearn.linear_model import LogisticRegression
>>> from skore import train_test_split
>>> from skore import EstimatorReport
>>> X, y = load_breast_cancer(return_X_y=True)
>>> split_data = train_test_split(X=X, y=y, random_state=0, as_dict=True)
>>> classifier = LogisticRegression(max_iter=10_000)
>>> report = EstimatorReport(classifier, **split_data)
>>> display = report.data.analyze()
>>> display.plot(kind="corr")
- set_style(**kwargs)[source]#
Set the style parameters for the display.
- Parameters:
- **kwargsdict
Style parameters to set. Each parameter name should correspond to a a style attribute passed to the plot method of the display.
- Returns:
- selfobject
Returns the instance itself.
- Raises:
- ValueError
If a style parameter is unknown.