Note
Go to the end to download the full example code.
Quick start#
From your Python code, create and load a skore Project:
import skore

my_project = skore.open("my_project", create=True)
This will create a skore project directory named quick_start.skore in your
current working directory. Note that overwrite=True will overwrite any pre-existing
project with the same path (which you might not want to do that depending on your use
case).
Evaluate your model using skore’s CrossValidationReport:
from sklearn.datasets import make_classification
from sklearn.linear_model import LogisticRegression

from skore import CrossValidationReport

X, y = make_classification(n_classes=2, n_samples=100_000, n_informative=4)
clf = LogisticRegression()

cv_report = CrossValidationReport(clf, X, y)
Processing cross-validation ━━━━━━━━━━━━━━━━━━━━━━━━━━━━━━━━━━━━━━━━ 100%
for LogisticRegression
Display the help tree to see all the insights that are available to you (given that you are doing binary classification):
╭─────────────────── Tools to diagnose estimator LogisticRegression ───────────────────╮
│ report                                                                               │
│ ├── .metrics                                                                         │
│ │   ├── .accuracy(...)         (↗︎)     - Compute the accuracy score.                 │
│ │   ├── .brier_score(...)      (↘︎)     - Compute the Brier score.                    │
│ │   ├── .log_loss(...)         (↘︎)     - Compute the log loss.                       │
│ │   ├── .precision(...)        (↗︎)     - Compute the precision score.                │
│ │   ├── .recall(...)           (↗︎)     - Compute the recall score.                   │
│ │   ├── .roc_auc(...)          (↗︎)     - Compute the ROC AUC score.                  │
│ │   ├── .custom_metric(...)            - Compute a custom metric.                    │
│ │   ├── .report_metrics(...)           - Report a set of metrics for our estimator.  │
│ │   └── .plot                                                                        │
│ │       ├── .precision_recall(...)     - Plot the precision-recall curve.            │
│ │       └── .roc(...)                  - Plot the ROC curve.                         │
│ ├── .cache_predictions(...)            - Cache the predictions for sub-estimators    │
│ │   reports.                                                                         │
│ ├── .clear_cache(...)                  - Clear the cache.                            │
│ └── Attributes                                                                       │
│     ├── .X                                                                           │
│     ├── .y                                                                           │
│     ├── .estimator_                                                                  │
│     ├── .estimator_name_                                                             │
│     ├── .estimator_reports_                                                          │
│     └── .n_jobs                                                                      │
│                                                                                      │
│                                                                                      │
│ Legend:                                                                              │
│ (↗︎) higher is better (↘︎) lower is better                                             │
╰──────────────────────────────────────────────────────────────────────────────────────╯
Display the report metrics that was computed for you:
df_cv_report_metrics = cv_report.metrics.report_metrics()
df_cv_report_metrics
Compute metric for each split ━━━━━━━━━━━━━━━━━━━━━━━━━━━━━━━━━━━━━━━━ 100%
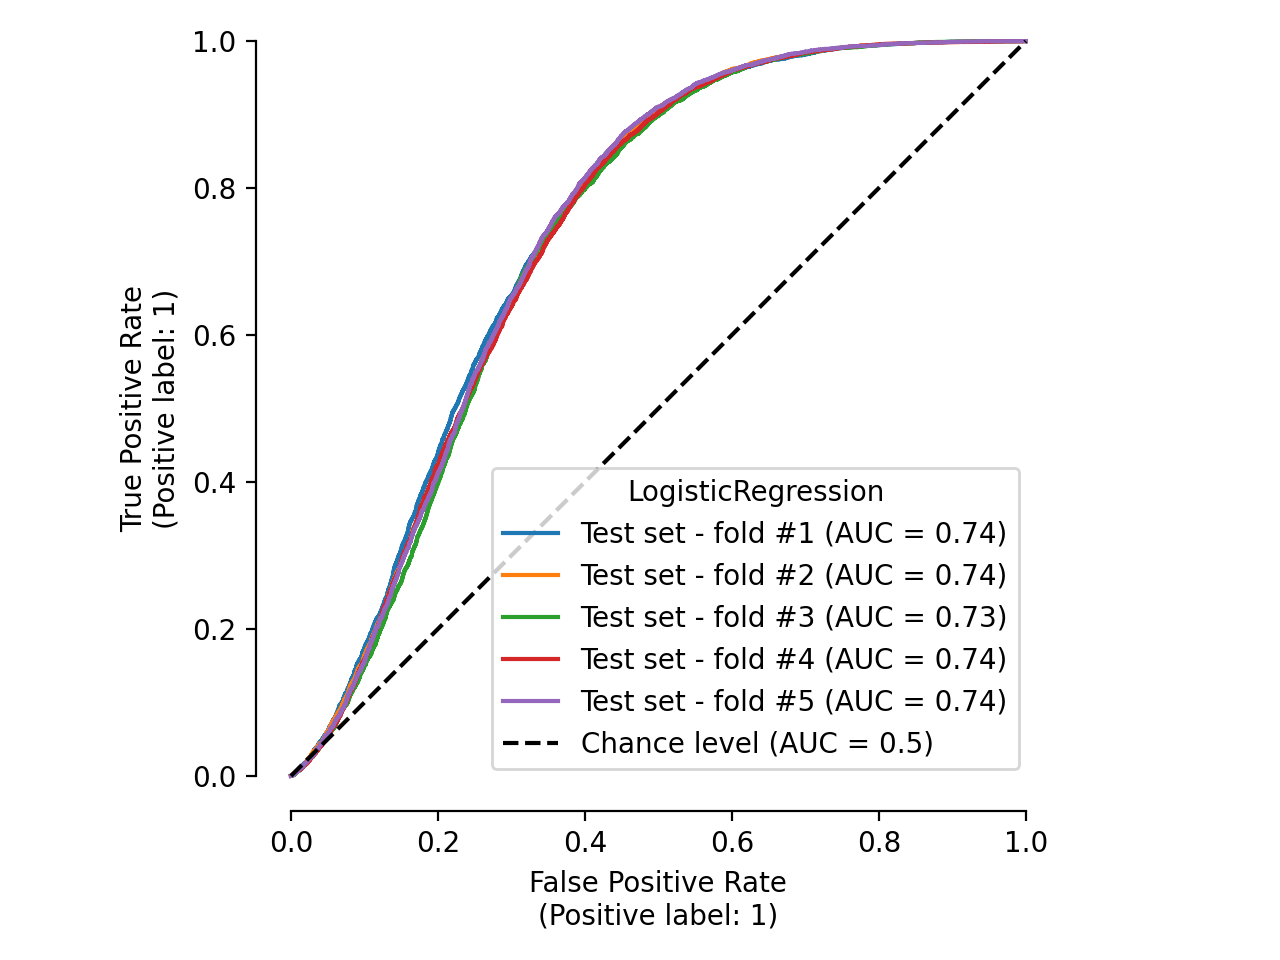
Display the ROC curve that was generated for you:
import matplotlib.pyplot as plt

roc_plot = cv_report.metrics.plot.roc()
roc_plot
plt.tight_layout()
Computing predictions for display ━━━━━━━━━━━━━━━━━━━━━━━━━━━━━━━━━━━━━━━━ 100%
Store the results in the skore project for safe-keeping:
my_project.put("df_cv_report_metrics", df_cv_report_metrics)
my_project.put("roc_plot", roc_plot)
What’s next?
For a more in-depth guide, see our Skore: getting started page!
Cleanup the project#
Let’s clear the skore project (to avoid any conflict with other documentation examples).
Total running time of the script: (0 minutes 1.961 seconds)