Note
Go to the end to download the full example code.
Quick start#
Machine learning evaluation and diagnostics#
Evaluate your model using skore’s EstimatorReport:
from sklearn.datasets import make_classification
from sklearn.linear_model import LogisticRegression
from sklearn.model_selection import train_test_split

from skore import EstimatorReport

X, y = make_classification(n_classes=2, n_samples=20_000, n_informative=4)
X_train, X_test, y_train, y_test = train_test_split(X, y, random_state=0)

log_report = EstimatorReport(
    LogisticRegression(),
    X_train=X_train,
    X_test=X_test,
    y_train=y_train,
    y_test=y_test,
    pos_label=1,
)
Display the help tree to see all the insights that are available to you (skore detected that you are doing binary classification):
╭─────────────────── Tools to diagnose estimator LogisticRegression ───────────────────╮
│ EstimatorReport                                                                      │
│ ├── .metrics                                                                         │
│ │   ├── .accuracy(...)         (↗︎)     - Compute the accuracy score.                 │
│ │   ├── .brier_score(...)      (↘︎)     - Compute the Brier score.                    │
│ │   ├── .confusion_matrix(...)         - Plot the confusion matrix.                  │
│ │   ├── .log_loss(...)         (↘︎)     - Compute the log loss.                       │
│ │   ├── .precision(...)        (↗︎)     - Compute the precision score.                │
│ │   ├── .precision_recall(...)         - Plot the precision-recall curve.            │
│ │   ├── .recall(...)           (↗︎)     - Compute the recall score.                   │
│ │   ├── .roc(...)                      - Plot the ROC curve.                         │
│ │   ├── .roc_auc(...)          (↗︎)     - Compute the ROC AUC score.                  │
│ │   ├── .timings(...)                  - Get all measured processing times related   │
│ │   │   to the estimator.                                                            │
│ │   ├── .custom_metric(...)            - Compute a custom metric.                    │
│ │   └── .summarize(...)                - Report a set of metrics for our estimator.  │
│ ├── .feature_importance                                                              │
│ │   ├── .coefficients(...)             - Retrieve the coefficients of a linear       │
│ │   │   model, including the intercept.                                              │
│ │   └── .permutation(...)              - Report the permutation feature importance.  │
│ ├── .cache_predictions(...)            - Cache estimator's predictions.              │
│ ├── .clear_cache(...)                  - Clear the cache.                            │
│ ├── .get_predictions(...)              - Get estimator's predictions.                │
│ └── Attributes                                                                       │
│     ├── .X_test                        - Testing data                                │
│     ├── .X_train                       - Training data                               │
│     ├── .y_test                        - Testing target                              │
│     ├── .y_train                       - Training target                             │
│     ├── .estimator                     - Estimator to make the report from           │
│     ├── .estimator_                    - The cloned or copied estimator              │
│     ├── .estimator_name_               - The name of the estimator                   │
│     ├── .fit                           - Whether to fit the estimator on the         │
│     │   training data                                                                │
│     ├── .fit_time_                     - The time taken to fit the estimator, in     │
│     │   seconds                                                                      │
│     ├── .ml_task                       - No description available                    │
│     └── .pos_label                     - For binary classification, the positive     │
│         class                                                                        │
│                                                                                      │
│                                                                                      │
│ Legend:                                                                              │
│ (↗︎) higher is better (↘︎) lower is better                                             │
╰──────────────────────────────────────────────────────────────────────────────────────╯
Display the report metrics that was computed for you:
metrics_summary = log_report.metrics.summarize()
metrics_summary
skore.MetricsSummaryDisplay(...)
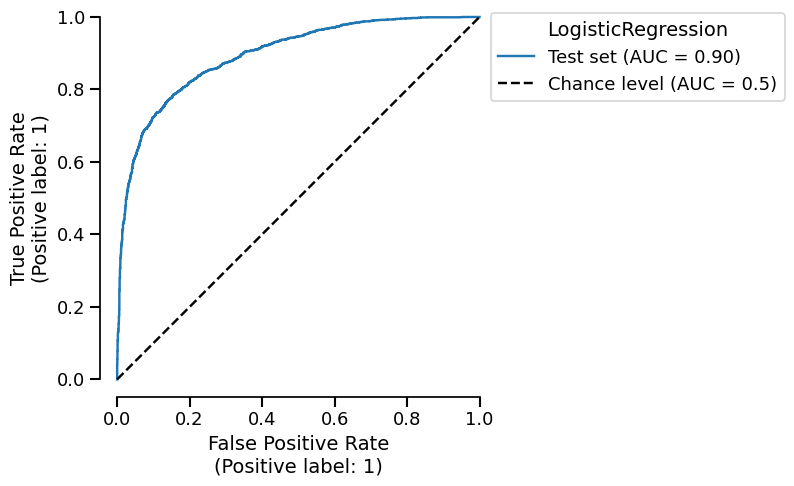
Display the ROC curve that was generated for you:
roc_plot = log_report.metrics.roc()
roc_plot.plot()
Skore project: storing some items#
From your Python code, create and load a skore Project:
import skore

my_project = skore.Project("my_project")
This will create a skore project directory named my_project.skore in your
current working directory.
Store some previous results in the skore project for safe-keeping:
my_project.put("log_report", log_report)
Let us store a second model:
from sklearn.ensemble import RandomForestClassifier

rf_report = EstimatorReport(
    RandomForestClassifier(),
    X_train=X_train,
    X_test=X_test,
    y_train=y_train,
    y_test=y_test,
)
my_project.put("rf_report", rf_report)
Now, let us retrieve the data that we previously stored:
summary = my_project.summarize()
print(type(summary))
<class 'skore.project.summary.Summary'>
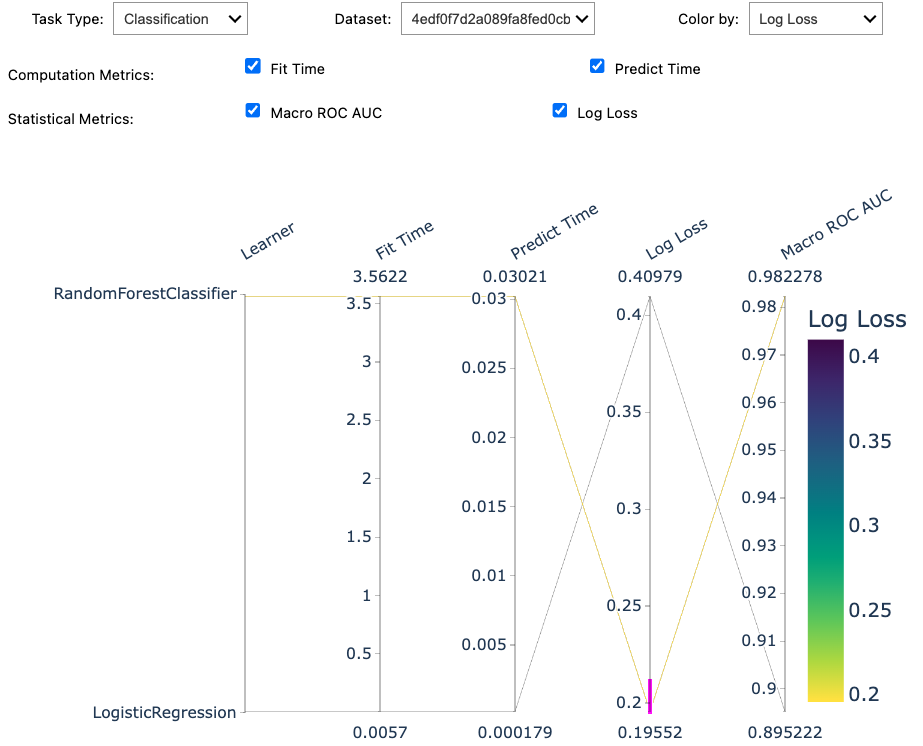
Note
If rendered in a Jupyter notebook, summary would render an interactive
parallel coordinate plot to search for your preferred model based on some metrics.
Here is a screenshot:
We can perform some queries on our stored data:
from pprint import pprint

report_get = summary.query("ml_task.str.contains('classification')").reports()
pprint(report_get)
[EstimatorReport(estimator=LogisticRegression(), ...),
 EstimatorReport(estimator=RandomForestClassifier(), ...)]
For example, we can retrieve the report metrics from the first estimator report:
report_get[0].metrics.summarize()
skore.MetricsSummaryDisplay(...)
See also
For a more in-depth guide, see our Skore: getting started page!
Total running time of the script: (0 minutes 7.054 seconds)