Local skore Project#

This example shows how to use Project in local mode: store reports on your machine and inspect them. A key point is that summarize() returns a Summary, which is a pandas.DataFrame. In Jupyter you get an interactive widget, but you can always inspect and filter the summary as a DataFrame if you prefer.

Create a local project and store reports#

We use a temporary directory as the workspace so the example is self-contained. In practice you can omit workspace to use the default (e.g. a skore/ directory in your user cache).

from pathlib import Path
from tempfile import TemporaryDirectory

from skore import Project

tmp_dir = TemporaryDirectory()
tmp_path = Path(tmp_dir.name)
project = Project("example-project", workspace=tmp_path)
from sklearn.datasets import load_breast_cancer
from sklearn.linear_model import LogisticRegression
from skore import train_test_split
from skrub import tabular_pipeline

X, y = load_breast_cancer(return_X_y=True, as_frame=True)
split_data = train_test_split(X=X, y=y, random_state=42, as_dict=True)
estimator = tabular_pipeline(LogisticRegression(max_iter=1_000))
╭────────────────────── HighClassImbalanceTooFewExamplesWarning ───────────────────────╮
│ It seems that you have a classification problem with at least one class with fewer   │
│ than 100 examples in the test set. In this case, using train_test_split may not be a │
│ good idea because of high variability in the scores obtained on the test set. We     │
│ suggest three options to tackle this challenge: you can increase test_size, collect  │
│ more data, or use skore's CrossValidationReport with the `splitter` parameter of     │
│ your choice.                                                                         │
╰──────────────────────────────────────────────────────────────────────────────────────╯
╭───────────────────────────────── ShuffleTrueWarning ─────────────────────────────────╮
│ We detected that the `shuffle` parameter is set to `True` either explicitly or from  │
│ its default value. In case of time-ordered events (even if they are independent),    │
│ this will result in inflated model performance evaluation because natural drift will │
│ not be taken into account. We recommend setting the shuffle parameter to `False` in  │
│ order to ensure the evaluation process is really representative of your production   │
│ release process.                                                                     │
╰──────────────────────────────────────────────────────────────────────────────────────╯
import numpy as np
from sklearn.base import clone
from skore import EstimatorReport

for regularization in np.logspace(-7, 7, 31):
    report = EstimatorReport(
        clone(estimator).set_params(logisticregression__C=regularization),
        **split_data,
        pos_label=1,
    )
    project.put(f"lr-regularization-{regularization:.1e}", report)

Summarize: you get a DataFrame#

summarize() returns a Summary, which subclasses pandas.DataFrame. In a Jupyter environment it renders an interactive parallel-coordinates widget by default.

summary = project.summarize()

To see the normal DataFrame table instead of the widget (e.g. in scripts or when you prefer the table), wrap the summary in pandas.DataFrame:

import pandas as pd

pandas_summary = pd.DataFrame(summary)
pandas_summary
key date learner ml_task report_type dataset rmse log_loss roc_auc fit_time predict_time rmse_mean log_loss_mean roc_auc_mean fit_time_mean predict_time_mean
id
0 504a631c81ca7300deca0255db418b1c lr-regularization-1.0e-07 2026-03-05T10:32:16.555686+00:00 LogisticRegression binary-classification estimator 0966e6e4b6a8c8bd5b0e6bd95f36939d None 0.662918 0.992509 0.132798 0.085042 None None None None None
1 bc1373a869d49f5bc57f8dd9ea218053 lr-regularization-2.9e-07 2026-03-05T10:32:16.828867+00:00 LogisticRegression binary-classification estimator 0966e6e4b6a8c8bd5b0e6bd95f36939d None 0.662790 0.992509 0.131227 0.082775 None None None None None
2 a55bbf6187f14f4253c92a4b3a306f57 lr-regularization-8.6e-07 2026-03-05T10:32:17.101068+00:00 LogisticRegression binary-classification estimator 0966e6e4b6a8c8bd5b0e6bd95f36939d None 0.662415 0.992509 0.131434 0.045437 None None None None None
3 da29ce901c40a2ac37bbcd5da6ae22c6 lr-regularization-2.5e-06 2026-03-05T10:32:17.245502+00:00 LogisticRegression binary-classification estimator 0966e6e4b6a8c8bd5b0e6bd95f36939d None 0.661320 0.992509 0.064659 0.039737 None None None None None
4 ecb0ab160328f39a9a570e81ee7dee34 lr-regularization-7.4e-06 2026-03-05T10:32:17.385280+00:00 LogisticRegression binary-classification estimator 0966e6e4b6a8c8bd5b0e6bd95f36939d None 0.658141 0.992509 0.065913 0.039632 None None None None None
5 c782a87c68a3512371a93efe39451017 lr-regularization-2.2e-05 2026-03-05T10:32:17.524631+00:00 LogisticRegression binary-classification estimator 0966e6e4b6a8c8bd5b0e6bd95f36939d None 0.649068 0.992509 0.064896 0.068099 None None None None None
6 6cd2cca0339cd282f9060fdca77c2ad3 lr-regularization-6.3e-05 2026-03-05T10:32:17.697833+00:00 LogisticRegression binary-classification estimator 0966e6e4b6a8c8bd5b0e6bd95f36939d None 0.624398 0.992926 0.067141 0.039602 None None None None None
7 8c26a3b4e22b6ad0a186534b62d9c6d5 lr-regularization-1.8e-04 2026-03-05T10:32:17.838578+00:00 LogisticRegression binary-classification estimator 0966e6e4b6a8c8bd5b0e6bd95f36939d None 0.565558 0.993550 0.066904 0.039098 None None None None None
8 918d6d318be8d528ea4bfe5d748ef2e3 lr-regularization-5.4e-04 2026-03-05T10:32:17.980947+00:00 LogisticRegression binary-classification estimator 0966e6e4b6a8c8bd5b0e6bd95f36939d None 0.460542 0.994382 0.065545 0.039714 None None None None None
9 457b8b56596a0ab167d1128c457fbfc6 lr-regularization-1.6e-03 2026-03-05T10:32:18.121774+00:00 LogisticRegression binary-classification estimator 0966e6e4b6a8c8bd5b0e6bd95f36939d None 0.336408 0.996047 0.064621 0.039888 None None None None None
10 6a2a720ba2b9ed54ee8a6b97209d7446 lr-regularization-4.6e-03 2026-03-05T10:32:18.276907+00:00 LogisticRegression binary-classification estimator 0966e6e4b6a8c8bd5b0e6bd95f36939d None 0.231201 0.997087 0.079631 0.039110 None None None None None
11 76dad5bec290bc5b4cc224fef2ea7713 lr-regularization-1.4e-02 2026-03-05T10:32:18.414606+00:00 LogisticRegression binary-classification estimator 0966e6e4b6a8c8bd5b0e6bd95f36939d None 0.155570 0.998335 0.064329 0.039455 None None None None None
12 cf449904ab64f50b2d77664e70dd1eb2 lr-regularization-4.0e-02 2026-03-05T10:32:18.552207+00:00 LogisticRegression binary-classification estimator 0966e6e4b6a8c8bd5b0e6bd95f36939d None 0.105629 0.998752 0.063714 0.041678 None None None None None
13 59a6a04260d0810c78c53b07cccace54 lr-regularization-1.2e-01 2026-03-05T10:32:18.692712+00:00 LogisticRegression binary-classification estimator 0966e6e4b6a8c8bd5b0e6bd95f36939d None 0.075737 0.998752 0.064330 0.038924 None None None None None
14 1219dfa31d0a0ffffa2796f84c6acedd lr-regularization-3.4e-01 2026-03-05T10:32:18.829939+00:00 LogisticRegression binary-classification estimator 0966e6e4b6a8c8bd5b0e6bd95f36939d None 0.060118 0.997919 0.064793 0.039124 None None None None None
15 74ffb2e932b7209874b9a40cdf17fc0a lr-regularization-1.0e+00 2026-03-05T10:32:18.978834+00:00 LogisticRegression binary-classification estimator 0966e6e4b6a8c8bd5b0e6bd95f36939d None 0.054072 0.997919 0.064993 0.049545 None None None None None
16 6eaf773baa9d5428824d4b0270a8a7af lr-regularization-2.9e+00 2026-03-05T10:32:19.128248+00:00 LogisticRegression binary-classification estimator 0966e6e4b6a8c8bd5b0e6bd95f36939d None 0.055710 0.997711 0.065115 0.039008 None None None None None
17 124d71d6ecf82b43e1aa6f4aaa2b57fb lr-regularization-8.6e+00 2026-03-05T10:32:19.268148+00:00 LogisticRegression binary-classification estimator 0966e6e4b6a8c8bd5b0e6bd95f36939d None 0.062825 0.997503 0.065699 0.039338 None None None None None
18 e084a9e027b14dcf3a3a04609d811334 lr-regularization-2.5e+01 2026-03-05T10:32:19.409773+00:00 LogisticRegression binary-classification estimator 0966e6e4b6a8c8bd5b0e6bd95f36939d None 0.080178 0.996463 0.067308 0.040023 None None None None None
19 b3dc3b0543016340d1bdb220ce12081e lr-regularization-7.4e+01 2026-03-05T10:32:19.556059+00:00 LogisticRegression binary-classification estimator 0966e6e4b6a8c8bd5b0e6bd95f36939d None 0.129576 0.993550 0.069961 0.041362 None None None None None
20 b3bd845564b5e34345d70e581d6f8850 lr-regularization-2.2e+02 2026-03-05T10:32:19.709108+00:00 LogisticRegression binary-classification estimator 0966e6e4b6a8c8bd5b0e6bd95f36939d None 0.245208 0.990845 0.075214 0.041106 None None None None None
21 8932395f48113dda2f24125dd5c484c1 lr-regularization-6.3e+02 2026-03-05T10:32:19.859663+00:00 LogisticRegression binary-classification estimator 0966e6e4b6a8c8bd5b0e6bd95f36939d None 0.450185 0.989180 0.072222 0.040512 None None None None None
22 cb4dd545d4fb71f9a648e424fb190888 lr-regularization-1.8e+03 2026-03-05T10:32:20.009830+00:00 LogisticRegression binary-classification estimator 0966e6e4b6a8c8bd5b0e6bd95f36939d None 0.737683 0.987516 0.073339 0.040332 None None None None None
23 1a482991163d34a7ca86c1b5fbb6b056 lr-regularization-5.4e+03 2026-03-05T10:32:20.168815+00:00 LogisticRegression binary-classification estimator 0966e6e4b6a8c8bd5b0e6bd95f36939d None 1.084853 0.987932 0.074249 0.081856 None None None None None
24 79687f85b64d698e58995a7b487dbe44 lr-regularization-1.6e+04 2026-03-05T10:32:20.441353+00:00 LogisticRegression binary-classification estimator 0966e6e4b6a8c8bd5b0e6bd95f36939d None 1.617311 0.981794 0.134933 0.081946 None None None None None
25 e7e1a00c8c4d91d8861983d116e2ad28 lr-regularization-4.6e+04 2026-03-05T10:32:20.719707+00:00 LogisticRegression binary-classification estimator 0966e6e4b6a8c8bd5b0e6bd95f36939d None 1.903156 0.982418 0.142315 0.085755 None None None None None
26 22c3e9cad8dc3d9fe247daf7dbb36f24 lr-regularization-1.4e+05 2026-03-05T10:32:21.005015+00:00 LogisticRegression binary-classification estimator 0966e6e4b6a8c8bd5b0e6bd95f36939d None 2.010251 0.982418 0.143769 0.082710 None None None None None
27 9a70c99b305e95f2e4d8e9ac8d545fd7 lr-regularization-4.0e+05 2026-03-05T10:32:21.286075+00:00 LogisticRegression binary-classification estimator 0966e6e4b6a8c8bd5b0e6bd95f36939d None 2.221514 0.981690 0.140758 0.081241 None None None None None
28 ffc908dbf2f065d97f277fa56fe5b374 lr-regularization-1.2e+06 2026-03-05T10:32:21.563019+00:00 LogisticRegression binary-classification estimator 0966e6e4b6a8c8bd5b0e6bd95f36939d None 2.268595 0.972950 0.137742 0.086332 None None None None None
29 f2e42095e9566aac46399f39bac36d65 lr-regularization-3.4e+06 2026-03-05T10:32:21.848778+00:00 LogisticRegression binary-classification estimator 0966e6e4b6a8c8bd5b0e6bd95f36939d None 2.268530 0.972950 0.142044 0.080970 None None None None None
30 efd96475308a445fb6de67fd47ad08e6 lr-regularization-1.0e+07 2026-03-05T10:32:22.122567+00:00 LogisticRegression binary-classification estimator 0966e6e4b6a8c8bd5b0e6bd95f36939d None 2.268482 0.973159 0.137180 0.082817 None None None None None


Basically, our summary contains metadata related to various information that we need to quickly help filtering the reports.

<class 'skore._project._summary.Summary'>
MultiIndex: 31 entries, (0, '504a631c81ca7300deca0255db418b1c') to (30, 'efd96475308a445fb6de67fd47ad08e6')
Data columns (total 16 columns):
 #   Column             Non-Null Count  Dtype
---  ------             --------------  -----
 0   key                31 non-null     object
 1   date               31 non-null     object
 2   learner            31 non-null     category
 3   ml_task            31 non-null     object
 4   report_type        31 non-null     object
 5   dataset            31 non-null     object
 6   rmse               0 non-null      object
 7   log_loss           31 non-null     float64
 8   roc_auc            31 non-null     float64
 9   fit_time           31 non-null     float64
 10  predict_time       31 non-null     float64
 11  rmse_mean          0 non-null      object
 12  log_loss_mean      0 non-null      object
 13  roc_auc_mean       0 non-null      object
 14  fit_time_mean      0 non-null      object
 15  predict_time_mean  0 non-null      object
dtypes: category(1), float64(4), object(11)
memory usage: 5.3+ KB

Filter reports by metric (e.g. keep only those above a given accuracy) and work with the result as a table.

summary.query("log_loss < 0.1")["key"].tolist()
['lr-regularization-1.2e-01', 'lr-regularization-3.4e-01', 'lr-regularization-1.0e+00', 'lr-regularization-2.9e+00', 'lr-regularization-8.6e+00', 'lr-regularization-2.5e+01']

Use reports() to load the corresponding reports from the project (optionally after filtering the summary).

reports = summary.query("log_loss < 0.1").reports(return_as="comparison")
len(reports.reports_)
6

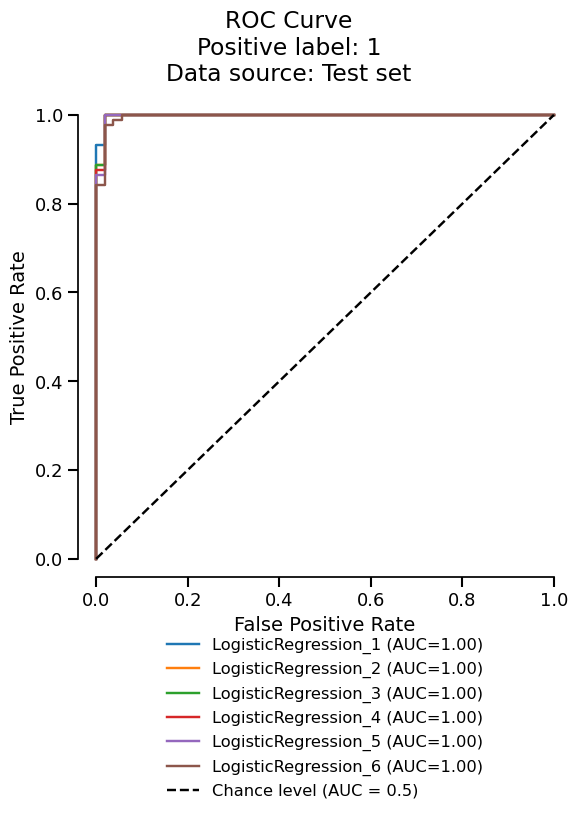
Since we got a ComparisonReport, we can use the metrics accessor to summarize the metrics across the reports.

reports.metrics.summarize().frame()
Estimator LogisticRegression_1 LogisticRegression_2 LogisticRegression_3 LogisticRegression_4 LogisticRegression_5 LogisticRegression_6
Metric
Accuracy 0.993007 0.993007 0.993007 0.979021 0.972028 0.979021
Precision 0.988889 0.988889 0.988889 0.988636 0.988506 0.988636
Recall 1.000000 1.000000 1.000000 0.977528 0.966292 0.977528
ROC AUC 0.998752 0.997919 0.997919 0.997711 0.997503 0.996463
Brier score 0.016769 0.014335 0.013810 0.015269 0.017996 0.022795
Fit time (s) 0.064330 0.064793 0.064993 0.065115 0.065699 0.067308
Predict time (s) 0.067092 0.067234 0.066732 0.067013 0.067536 0.066497


reports.metrics.roc().plot(subplot_by=None)
ROC Curve Positive label: 1 Data source: Test set
project.delete("example-project", workspace=tmp_path)
tmp_dir.cleanup()

Total running time of the script: (0 minutes 8.021 seconds)

Gallery generated by Sphinx-Gallery